It's interesting to see the first high-speed train line in spain (Madrid-Seville) doesn't appear. I'll see if I can fix that.
- Taiwan has an insane rail network of a few hundred lines - half of the streamlines in Amsterdam are tram 7, apparently it takes you everywhere. - there seems to be an assumption all lines stop on all stations they pass - quite a few regional Train lines are committed in the Netherlands
And finally I woul love a bus version too!
Keep up the good work
> One approach that seems to use a model similar to ours was described by Anton Dubreau in a blog post
[0] https://ad-publications.informatik.uni-freiburg.de/ACM_effic...
Such a great piece of work, very interesting.
It's really nice to be able to switch seamlessly between a Geographic, Octilinear and Geo-Octilinear view of the maps, because each of them tells you something useful. I would use this if TFL added it to their maps app.
https://loom.cs.uni-freiburg.de/global#subway-lightrail/octi...
Since the days of Harry Beck, transit maps have mostly been created manually by professional map designers (Garland Citation1994; Wu et al. Citation2020). The primary focus was on static maps, either distributed in print or electronically. These maps are typically schematic, and the classic octilinear design (network segment orientations are multiples of 45∘) is still prevalent. In the late 1990s, the graph drawing community started to investigate the problem of drawing such maps automatically. The following questions were investigated: (1) How can graphs be drawn in an octilinear fashion? (2) Which hard criteria should a transit map fulfil? (3) Which soft criteria should be optimized? Several methods have since been proposed (see below). A set of soft and hard criteria, first described by Nöllenburg (Citation2005), has since been generally accepted. The important sub-problem of finding an optimal line ordering of lines travelling through network segments has also been identified very early by Benkert et al. (Citation2006).
* every bit that's in OSM, I suppose
hurrah for computer science BUT this is also graphic design, with human factors, and simultaneously authoritative data that does matter to many real people. Easy tag-on criticism is "who needs all transit maps worldwide at all times" ? Isn't it obviously more important to have reliable, accurate, readable maps for the people who are using the system heavily in that area, instead of stretching all of those qualities to get a toy-prize for armchair readers and the world cloud servers on the Internet? common sense plays a role in the guaging accolades here IMHO
In most places still, changes to these maps need to go through lots of people process. This implies they're slow to update, and therefore often not entirely accurate or optimally understandable. For example, consider service works or temporary outtages.
The outcome of this research is not a toy-prize for armchair readers, but a generalized algorithmic approach to building necessary and important accessibility tools.
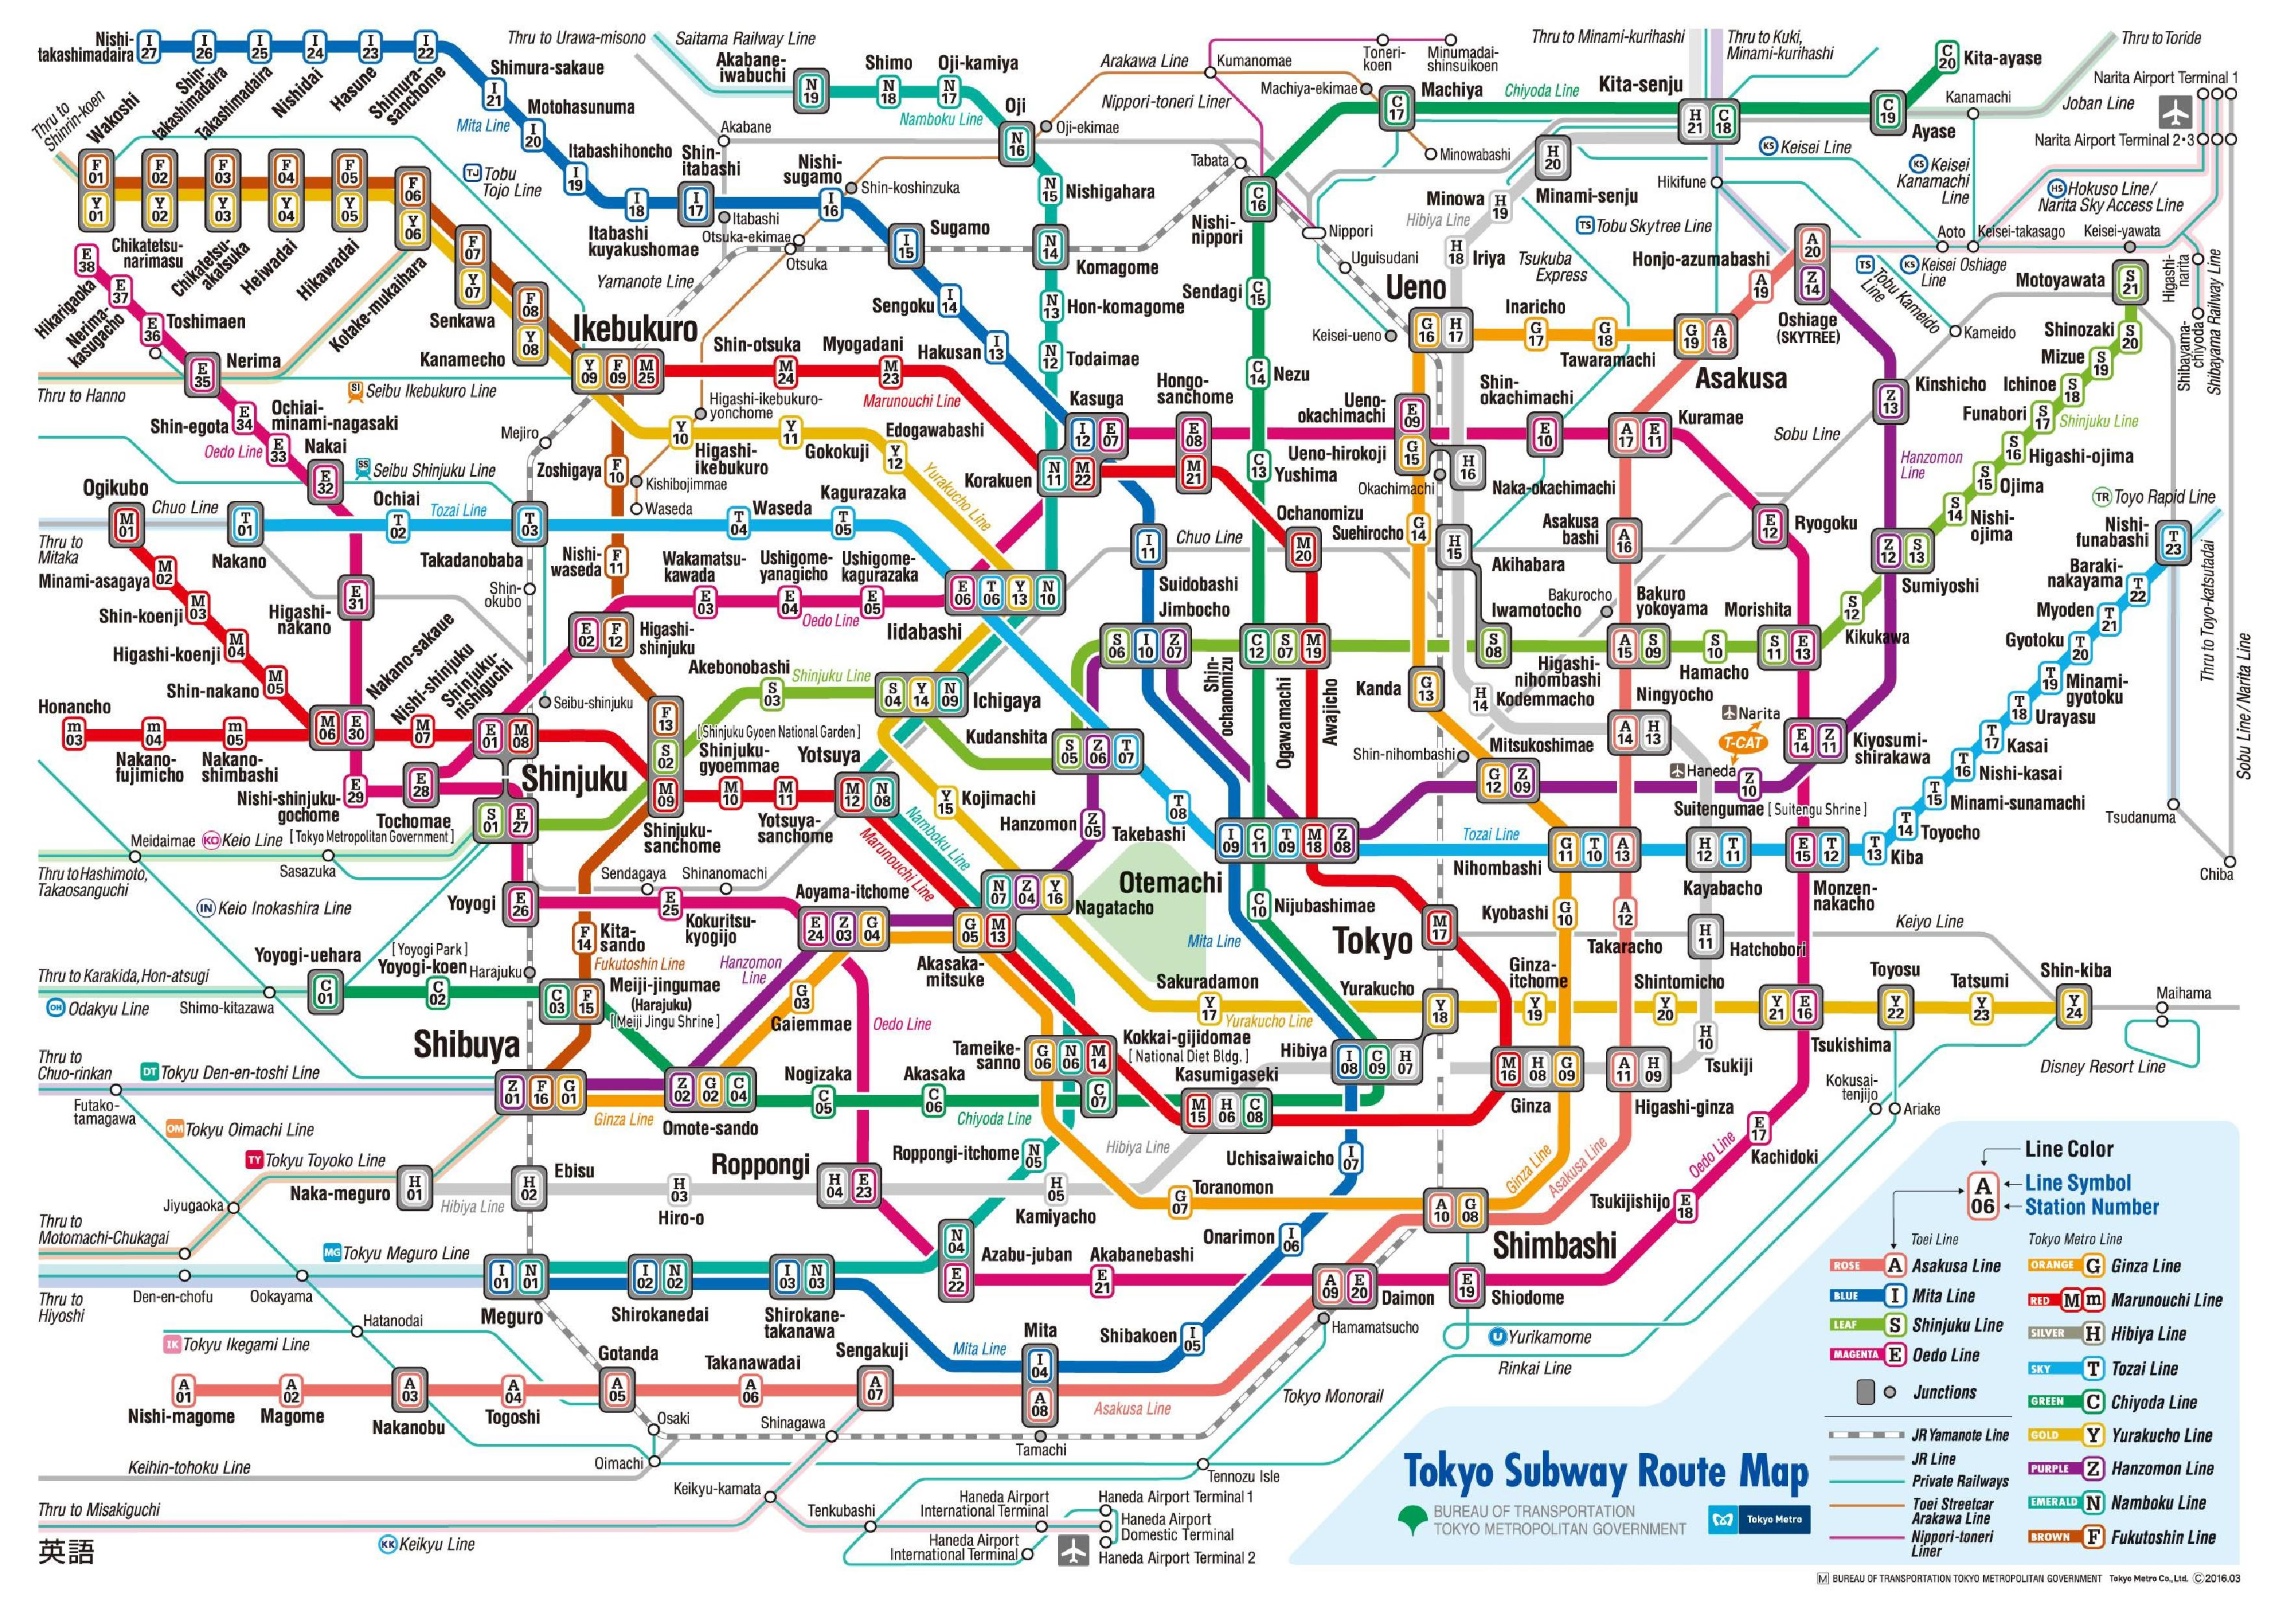
Granted, Tokyo has a blended commuter / subway through-service system (eg, Fukutoshin-line trains continue into the Toyoko-line), but those trains don't seem to show up in either Rail or Subway views.
Most likely, they just left out the JR Rail and other lines because the map is way too complicated with them, or perhaps it broke their algorithm.
They also didn't show the entire Tokyo metro area, which is much larger than this and includes Yokohama. It's understandable, though: the entire Tokyo metro area is enormous (though perhaps not compared to many American cities like Phoenix, if you just look at land area, but those cities have nowhere near the density of Tokyo), and a map of the entire thing is usually too complicated to bother with, so zoomed-in maps are more useful. This one is showing central Tokyo (the part encircled by the Yamanote line) and parts not too far from it.
The answer for this, I think, is that either the OSM data (input) needs to adapt to fit what this system can read or patch rules and patch data can be applied to fix up the output.
Either way it is a distributed project, people in Tokyo or Hannover or any place where it is wrong are the people who would know what is right so they should be engaged in the solution.
It shows the subways, but also adds on the relevant JR rail lines and lines from other companies. Honestly, I don't see how this project could improve on this; the current map is already packed full of information.
Would live to hear more about the motivation for using RDF/SPARQL in the technology stack as these are frequently seen as arcane and here is a very intuitive use case.
The key though is coining good identifiers, developing a good set of properties, and understanding how datatype properties work and using them well. It's very easy to develop a bad standard like Dublin Core that, unfortunately, perpetuates the bad stereotypes people have of the RDF world.
The SPARQL spec is dense reading
https://www.w3.org/TR/sparql12-query/
but it's a tiny spec. The SQL spec on the other hand is broken up into numerous $200 documents and if you did look at them you'd find it's much much messier. If you felt SPARQL needed something extra it's a good base to work from to develop some kind of SPARQL++ and the same is true with the RDF model. (e.g. add something to every triple to record provenance, for instance)
My two complaints with SPARQL are: (1) there are two official ways to represent ordered collections and a third unofficial one; if you are good at SPARQL you can write queries that can do the obvious things you want to do with ordered collections (like you'd see in JSON query languages like N1QL or AQL) but there ought to be built in functions that just do it, (2) you can write path queries like
?s (ex:motherOf|ex:fatherOf)+ ?o .
and, in terms of capabilities, MARC comes out way ahead. MARC is a standard for a university library, Dublin Core seems to be a standard that almost works for an elementary school library.
(2) Specifically, people who write a paper or a book will get prickly about the order that authors are listed in, but Dublin Core doesn't provide a good answer, particularly if you want to use authority records. I mean
   :Paper
       dcterms:creator "Alpher, Ralph" ;
       dcterms:creator "Bethe, Hans" ;
       dcterms:creator "Gamow, George " .
    :Paper
       dcterms:creator ("Alpher, Ralph" "Bethe, Hans" "Gamow, George") .
https://github.com/adobe/XMP-Toolkit-SDK/blob/main/docs/XMPS...
and boy there was a lot of good ideas in the XMP spec but Adobe wound up NERFing the implementation because Adobe was accused of throwing it's weight around too much. Sure you could write
:Paper dcterms:creator "Ralph Alpher, Hans Bethe, George Gamow" .