Hyperthreading (SMT) and Turbo (clock scaling) are only a part of the variables causing non-linearity, there are a number of other resources that are shared across cores and "run out" as load increases, like memory bandwidth, interconnect capacity, processor caches. Some bottlenecks might come even from the software, like spinlocks, which have non-linear impact on utilization.
Furthermore, most CPU utilization metrics average over very long windows, from several seconds to a minute, but what really matters for the performance of a latency-sensitive server happens in the time-scale of tens to hundreds of milliseconds, and a multi-second average will not distinguish a bursty behavior from a smooth one. The latter has likely much more capacity to scale up.
Unfortunately, the suggested approach is not that accurate either, because it hinges on two inherently unstable concepts
> Benchmark how much work your server can do before having errors or unacceptable latency.
The measurement of this is extremely noisy, as you want to detect the point where the server starts becoming unstable. Even if you look at a very simple queueing theory model, the derivatives close to saturation explode, so any nondeterministic noise is extremely amplified.
> Report how much work your server is currently doing.
There is rarely a stable definition of "work". Is it RPS? Request cost can vary even throughout the day. Is it instructions? Same, the typical IPC can vary.
Ultimately, the confidence intervals you get from the load testing approach might be as large as what you can get from building an empirical model from utilization measurement, as long as you measure your utilization correctly.
What most people care about is some combination of latency and utilization. As a very rough rule of thumb, for many workloads you can get up to about 80% CPU utilization before you start seeing serious impacts on workload latency. Beyond that you can increase utilization but you start seeing your workload latency suffer from all of the effects you mentioned.
To know how much latency is impacted by utilization you need to measure your specific workload. Also, how much you care about latency depends on what you're doing. In many cases people care much more about throughput than latency, so if that's the top metric then optimize for that. If you care about application latency as well as throughput then you need to measure both of those and decide what tradeoffs are acceptable.
I think this is probably one of the most important points... similarly, is this public facing work dealing with any kind of user request, or is it simply crunching numbers/data to build an AI model from a stable backlog/queue?
My take has always been with modern multi-core, hyper-threaded CPUs that are burstable is to consider ~60% a "loaded" server. That should have work split if it's that way for any significant portion of a day. Mostly dealing with user-facing services. So bursts and higher traffic portions of the day are dramatically different from lower utilization portions of the day.
A decade ago, this lead to a lot of work for cloud provisioning on demand for the heavier load times. Today it's a bit more complicated when you have servers with 100+ cores as an option for under $30k (guestimate based on $10k CPU price). Today, I'd lean to over-provisioning dedicated server hardware and supplement with cloud services (and/or self-cloud-like on K8s) as pragmatically as reasonable... depending on the services of course. I'm not currently in a position where I have this level of input though.
Just looking at how, as an example, StackOverflow scaled in the early days is even more possible/prudent today to a much larger extent... You can go a very long way with a half/full rack and a 10gb uplink in a colo data center or two.
In any case, for me... >= 65% CPU load for >= 30m/day means it's at 100% effective utilization, and needs expansion relatively soon. Just my own take.
I think this depends on workload still because IO heavy apps hyperthread well and can push up to 100%. I think most of the apps I've worked on end up being IO bound because "waiting on SQL results" or the more generic "waiting on downstream results" is 90% of their runtime. They might spend more time reading those responses off the wire than they do actually processing anything.
There are definitely things that isn't true of though, and your metrics read about right to me.
If one can buy used, then previous generation 128C 256T epyc server is less than $5k. For homelabs that can accept non-rackmount gear it's less than $3k.
The lie is the assumption that CPU time is linear in useful work, but that has nothing to do with the definition of utilization, it's just something that people sometimes naively believe.
> CPU utilization isn't a lie, % CPU utilization is
What do you mean by this? Utilization is, by definition, a ratio. % just determines that the scale is in [0, 100].
The %CPU suggestions ran contrary to (and were much more conservative than) the "old wisdom" that would otherwise have been used. It worked out great at much lower cost than otherwise.
What I'm trying to say is you shouldn't be afraid of using semi-crappy indicators just because they're semi-crappy. If it's the best you got it might be good enough anyway.
In the case of CPU utilisation, though, the number in production shouldn't go above 40 % for many reasons. At 40 % there's usually still a little headroom. The mistake of the author was not using fundamentals of queueing theory to avoid high utilisation!
Agree. Another example of this is for metrics as percentiles per host that you have to average, vs histograms per host that get percentile calculated at aggregation time among hosts. Sure an avg/max of a percentile is technically not a percentile, but in practice switching between one or the other hasn’t affected my operations at all. Yet I know some people are adamant about mathematical correctness as if that translates to operations.
It's not good to go much over 50% on a server (assuming half the cpus are just hyperthreads), because you're essentially relying on your load being able to share the actual cpu cores. At some point, when the load increases too much, there may not be any headroom left for sharing those physical cpus. You then get to the point where adding a little bit more load to 80% suddenly results in 95% utilization.
The important part is of course to ask yourself the question "how much increased load may I need to handle, and how much can I degrade system performance in doing so?" You may work in an industry that only ever sees 10 % additional load at timescales where scaling is unfeasible, and then you can pick a significantly higher normal utilisation level. Or maybe you're in an industry where you cannot degrade performance by more than 10 % even if hit by five times the load – then you need a much, much more conservative target for utilisation.
[0]: https://www.brendangregg.com/blog/2017-05-09/cpu-utilization...
It should be possible from the information you can get on a CPU from the OS to better estimate utilisation involving at the very least these two factors. It becomes a bit more tricky to start to account for significantly going past the cache or available memory bandwidth and the potential drop in performance to existing threads that occurs from the increased pipeline stalls. But it can definitely be done better than it is currently.
IBM's Power cpu's have also traditionally done a great job with SMT compared to Intel's implementation.
But overall yeah.
Going from 1 thread to 2 threads doubled the speed as expected. Going from 2 to 4 doubled it again. Going from 4 to 8 was only ~15% faster.
I imagine you could probably create a contrived benchmark that actually gives you nearly double the performance from SMT, but I don't know what it would look like. Maybe some benchmark that is written to deliberately constantly miss cache?
Side note, I should run that POV-Ray test again. It's been years since I've even use POV-Ray.
Especially when it come to those advertisements “6 large rolls == 18 normal rolls”.
Sure it might be thicker but nobody wipes their butt with 1/3 a square…
as in youd only use it to wipe excrement from around your sphincter
The difference between two threads and one core or two cores with shared resources?
Nothing is really all that neat and clean.
It more of a 2 level NUMA type architecture with 2 sets of 6 SMP sets of 2.
The scheduler may look at it that way (depending), but to the end user? Or even to most of the system? Nah.
Instead of having a big core with two instruction pipelines sharing big ALUs etc, they have two (or more) cores that combine resources and become one core.
Almost the same, yet quite different.
I didn't expect an article on this style. I was expecting the normal Linux/Windows utilization but wtf it's all RAM bottlenecked and the CPU is actually quiet and possibly down clocking thing.
CPU Utilization is only how many cores are given threads to run by the OS (be it Windows or Linux). Those threads could be 100% blocked on memcpy but that's still CPU utilization.
-------
Hyperthreads help: if one thread is truly CPU bound (or even more specifically: AVX / Vector unit bound), while a 2nd thread is hyperthreaded together that's memcpy / RAM bound, you'll magically get more performance due to higher utilization of resources. (Load/store units are separate from AVX compute units).
In any case, this is a perennial subject with always new discoveries about how CPU Utilization is far less intuitive than many think. Still kinda fun to learn about new perspectives on this matter in any case.
There are many reasons for the lack of a proportional relationship, even in the case where you do not have hyperthreading or downclocking (in which cases you just need to interpret %CPU utilisation in that context, rather than declare it "a lie"). Even in apple silicon where these are usually not an issue, you often do not get an exactly proportional scaling. There may be overheads when utilising multiple cores wrt how data is passed around, or resource bottlenecks other than CPU.
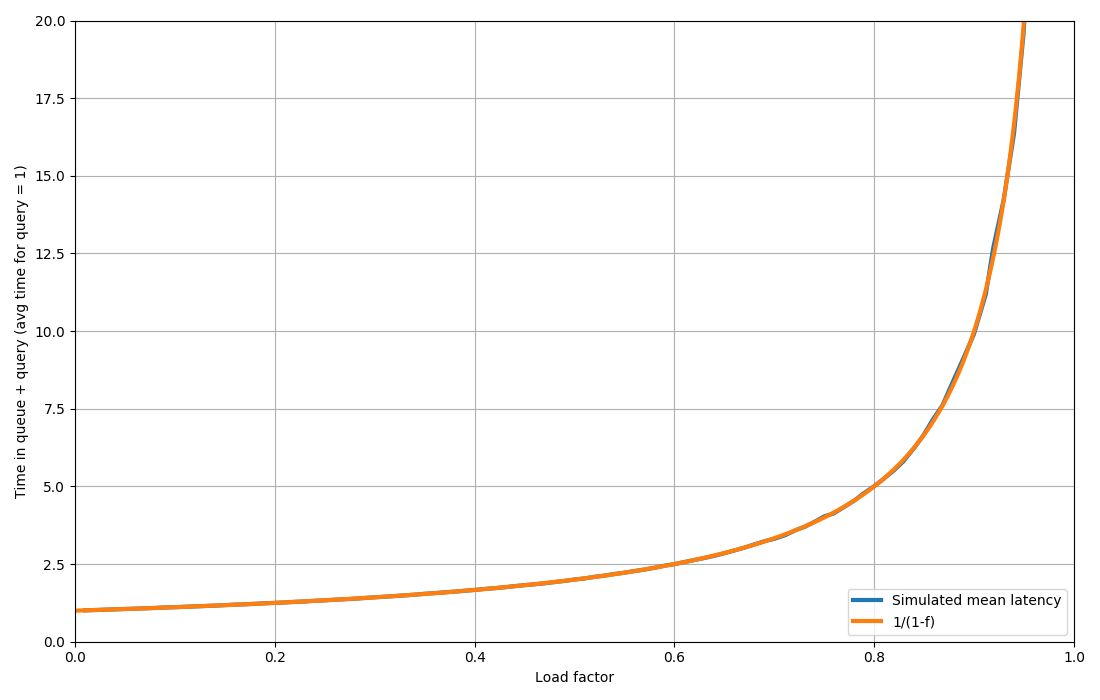
Up to a hair over 60% utilization the queuing delays on any work queue remain essentially negligible. At 70 they become noticeable, and at 80% they've doubled. And then it just turns into a shitshow from there on.
The rule of thumb is 60% is zero, and 80% is the inflection point where delays go exponential.
The biggest cluster I ran, we hit about 65% CPU at our target P95 time, which is pretty much right on the theoretical mark.
One way to get closer to reliable performance is to apply cpu scheduler limits to what runs your applications to keep them below a given threshold. This way you can better ensure you can sustain a given amount of performance. You don't want to run at 100% cpu for long, especially if disk i/o becomes hampered, system load skyrockets, and availability starts to plummet. Two thousand servers with 5000ms ping times due to system load is not a fun day at the office.
(And actually you'll never get a completely accurate view, as performance can change per-server. Rack two identical servers in two different racks, run the same app on each, and you may see different real-world performance. One rack may be hotter than the other, there could be hidden hardware or firmware differences, etc. Even within a server, if one CPU is just nearer a hotter component than on another server, for reasons)
- Pinned to 6 cores: 28k QPS
- Pinned to 12 cores: 56k QPS
- All 24 cores: 62k QPS
I'm not sure how this applies to realistic workloads where you're using all of the cores but not maxing them out, but it looks like hyperthreading only adds ~10% performance in this case.
The simple "big-o" number doesn't account for whether you need to pass terabytes over the bus for every operation - and on actual computers moving around terabytes, I know, shockingly, this affects performance.
And if you have a dual epyc board with 1,024 threads, being able to parallelize a solution and design things for cache optimization, this isn't meaningless.
It's a weak classifier - if you really think I'm going to be doing a lexical sort in like O(n^3) like some kind of clown, I don't know what you're hiring here.
Found out later he scored me "2/5".
Alright, cool.
(chat, it was not. busy waiting is CPU utilisation too)
It's gotta be at least 2 out of every 3 chip generations going back to the original implementation, where you're better off without it than with.
Of course, if the CPU governor is set to “performance” or “game mode”, then the OS should use as many pairs as possible instead (unless thermal throttling matters; computers are hard).
So now you have a choice of either disabling SMT in the bios, or make sure the application correctly interprets the CPU topology and only spawns one thread per physical core. The former is often the easier option, both from software development and system administration perspective.
Other benefits: per-CPU software licencing sometimes, and security on servers that share CPU with multiple clients.
I’m familiar with one such system where the throughput benefit is ~15%, which is a big deal for a BIOS flag.
IBM’s POWER would have been discontinued a decade ago were it not for transactional database systems, and that architecture is heavily invested in SMT, up to 8-way(!)
(Intel and AMD stopped at 2! Apparently more wasn't worth it for them. Presumably because the cpu was doing enough of the right thing already.)
Power systems tend not to be under the same budget constraints as intel, whether thats money, power, heat, whatever, so the cost benifit of adding more sub-core processing for incremental gains is likely different too.
I may have a raft of issues with IBM, and aix, but those Power chips are top notch.
I guess in general parallelism inside a core will either be extracted by the computer automatically with instruction-level-parallelism, or the programmer can tell it about independent tasks, using hyperthreads. So the hyperthread implementations are optimistic about how much progrmmers care about performance, haha.
In addition to needing SMT to get full performance, there were a lot of other small details you needed to get right on Xeon Phi to get close to the advertised performance. Think of AVX512 and the HBM.
For practical applications, it never really delivered.
The primary trade-off is the cache utilization when executing two sets of instruction streams.
You could do one thread for every two cores, three threads for every 2 cores, one thread per core ± 1, or both (2n + 1).
Unfortunately the sweet spot based on our memory usage always came out to 1:1, except for a while when we had a memory leak that was surprisingly hard to fix, and we ran n - 1 for about 4 months while a bunch of work and exploratory testing were done. We had to tune in other places to maximize throughput.
https://www.tomshardware.com/pc-components/cpus/zen-4-smt-fo...
I think there's two kinds of loads where hyperthreads aren't more likely to hurt than help. If you've got a tight loop that uses all the processor execution resources, you're not gaining anything by splitting that in two, it just makes things harder. Or if your load is mostly bound by memory bandwidth without a lot of compute... having more threads probably means you're that much more oversubscribed on i/o and caching.
But a lot of loads are grab some stuff from memory and then do some compute, rinse and repeat. There's a lot of potential for idle time while waiting on a load, being able to run something else during that time makes a lot of sense.
It's worth checking how your load performs with hyperthreads off, but I think default on is probably the right choice.
For many years (still?) it was faster to run your database with hyper threading turned off and your app server with it turned on.
Yet I'm still surprised by this benchmark. On both Zen2 and Zen4 in my tests (5900X from the article is Zen3), matrixprod still benefits from hyperthreading and scales a bit after all the physical cores are filled, unlike what the article results show.
All of this is tangential of course, as I'd tend to agree that CPU utilization% is just an imprecise metric and should only be used as a measure of "is something running".
I've ran some ML experiments on my 5950x and I can tell that the CPU utilization figure is entirely decoupled from physical reality by observing the amount of flicker induced in my office lighting by the PWM noise in the machine. There are some code paths that show 10% utilization across all cores but make the cicadas outside my office window stop buzzing because the semiconductors get so loud. Other code paths show all cores 100% maxed flatline and it's like the machine isn't even on.
The other thing I think we have a hard time visualizing is that processor is only either executing (100%) or its waiting to execute (0%) and that happens over varying timescales... so trying to assign a % in between inherently means you're averaging over some arbitrary timescale...
It wouldn't really make sense to include all parts of the CPU in the calculation.
Ctrl-Alt-Del then launch TaskManager.
In TaskManager, click the "Performance" tab and see the simple stats.
While on the Performance tab, then click the ellipsis (. . .) menu, so you can then open ResourceMonitor.
Then close TaskManager.
In ResourceMonitor, under the Overview tab, for the CPU click the column header for "Average CPU" so that the processes using the most CPU are shown top-down from most usage to least.
In Overview, for Disk click the Write (B/sec) column header, for Network click Send (B/sec), and for Memory click Commit (KB).
Then under the individual CPU, Memory, Disk, and Network tabs click on the similar column headers. Under any tab now you should be able to see the most prominent resource usages.
Notice how your CPU settles down after a while of idling.
Then click on the Disk tab to focus your attention on that one exclusively.
Let it sit for 5 or 10 minutes then check your CPU usage. See if it's been climbing gradually higher while you weren't looking.
"data" / "stats" are only a report, and that report is often incorrect.
They've been advocating against SMT for a long while, citing security risks and inconsistent performance gains. I don't know which HW/CPU bug in the long series of rowhammer, meltdown, spectre, etc prompted the action, but they've completely disabled SMT in the default installation at some point.
The core idea by itself is fine: keep the ALUs busy. Maybe security-wise, the present trade-off is acceptable, if you can instruct the scheduler to put threads from the same security domain on the same physical core. (How to tell when two threads are not a threat to each other is left up as an exercise.)
As for the article, the slowdown can be also caused by increased use of shared resources like caches, TLBs, branch predictors.
Most users actually wants a list of ”what can I kill to make the computer faster”, I.e. they want an oracle (no pun) that knows how fast the computer will be if different processes are killed.
System load is well defined, matches user expectations, and covers several edge cases (auditd going crazy, broken CPU timers, etc).
(1) Measure MIPS with perf (2) Compare that to max MIPS for your processor
Unfortunately, MIPS is too vague since the amount of work done depends on the instruction, and there's no good way to measure max MIPS for most processors. (╯°□°)╯︵ ┻━┻
On AMD, threads may as well be cores. If you take a Ryzen and disable SMT, you're basically halving its parallelism, at least for some tasks. On Intel you're just turning off an extra 10-20%.
https://www.techpowerup.com/review/amd-ryzen-9-9700x-perform...
The benchmarks show a 10% drop in "application" performance when SMT is disabled, but an overall 1-3% increase in performance for games.
From a hardware perspective, I can't imagine how it could be physically possible to double performance by enabling SMT.